Professional Weather Graphics
Visualize weather simulation data across global and high-resolution regional models
Visualize weather simulation data across global and high-resolution regional models
Flowx delivers a uniquely powerful way to see and interact with weather simulation data. Explore its rich features to discover a weather app like no other, remarkably comprehensive yet straightforward to use.

Experience weather in motion with our unique swipe animations offering smooth and responsive visuals. Flowx is engineered for speed, featuring fast data downloads, quick loading times, and fluid map interactions. Glide through time to watch weather patterns evolve, and get your 'weather at a glance'.

Access a vast range of global models (GFS, ECMWF, ICON, GDPS) and high-resolution regional models (HRRR, NAM, HRDPS, Arome, ICON-D2, HARMONIE, and many more). Directly compare model outputs on the map and in graphs.

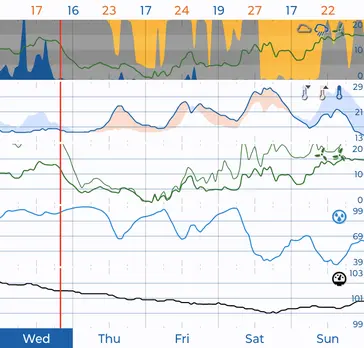
Select from common weather data, plus specialized types including radar, air quality, marine (waves, currents, sea temps), smoke, UV, visibility, storm indices (CAPE, Lifted Index), and cloud layers.
Detailed marine forecasts for safe and enjoyable voyages
Comprehensive weather insights for outdoor expeditions
Plan shoots with precise weather and lighting predictions


Join thousands of users who rely on our app for accurate, timely and professional weather updates.