Edit Data
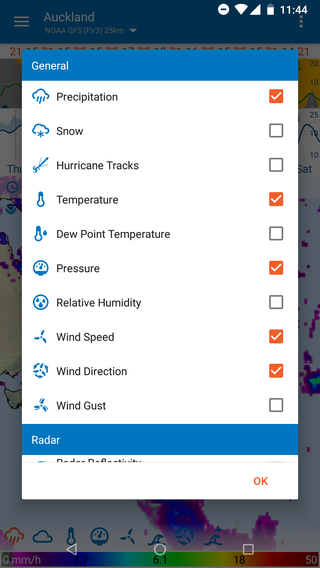
To add/remove data types from the icon bar on the map:
- Select Edit Data from the top right menu
- Select or deselect data types - scroll down for more data options
- Click OK to save and return to main screen
Tip: to rearrange the order of data icons at the bottom map, long press an icon and drag to new position in the line.
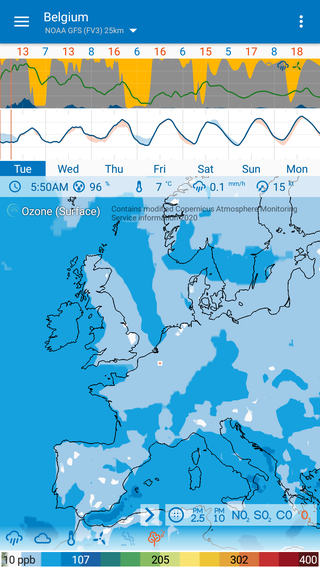
Data Sub-Menus
Data that has multiple sub-types, such as Air Quality, have a sub-menu which will appear above the data icon when selected.
- Click on the specific data type required.
- To hide/unhide the sub-menu, click the arrow
- To change data model, click the circle icon in the submenu and select the model required.
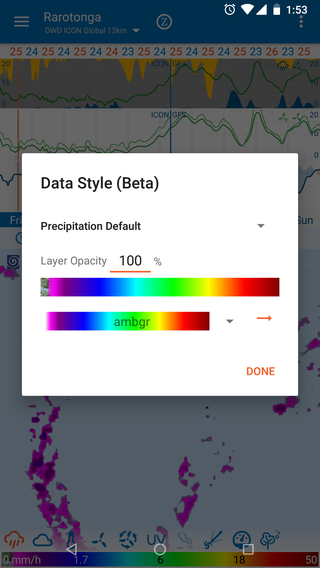
Edit Data Style
To edit the data apperance options, long-press on the spectrum bar at the bottom of the map, which will bring up the Data Style dialog box. Make changes to the Template Style, Opacity, Min/Max and/or Spectrum, then click Done.
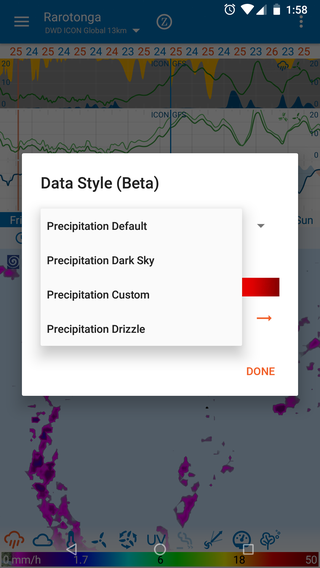
Template Styles
To choose from a list of template styles, click the drop down arrow in the top right of the dialog box and select an option. Styles are applied globally across all your places.
NOTE: if you change any settings within a template style, these will be saved.
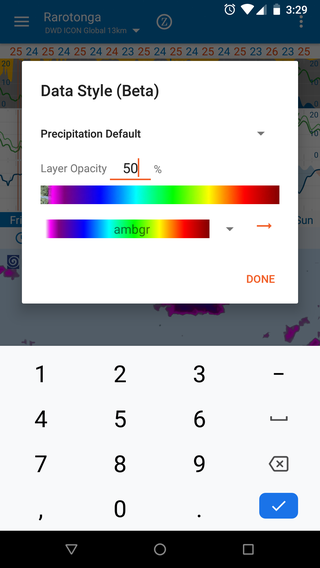
Opacity
To adjust the percentage of opacity (degree of obscuring) of the colour spectrum, enter a number between 0-100 in the Layer Opacity.
Min/Max
For some data types, you can adjust the minimum and maximum settings of the scale. Enter the 'min' setting on the left and 'max' setting on the right.
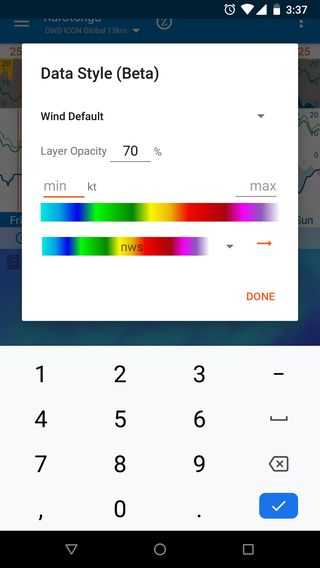
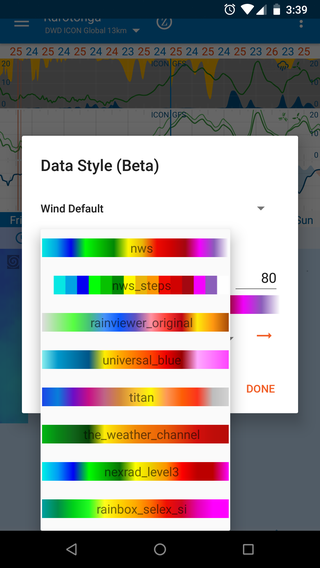
Spectrum
To change the individual colour spectrum, click on the dropdown arrow next to the colour spectrum name (e.g. bgrm), scroll to see all options, and click on one to select.
To reverse the colour order within a spectrum, click the arrow to the right of the spectrum name